National

Aquatic Barrier Inventory & Prioritization Tool

Aquatic Barrier Tool

Pacific Southwest Region
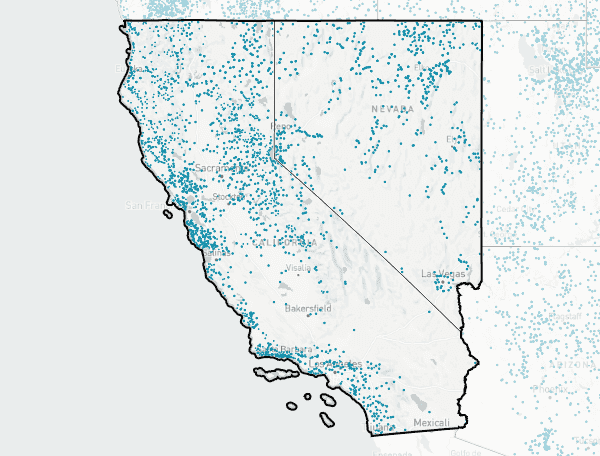
Pacific Southwest region map
Map of 5,704 inventoried dams and 3,942 road-related barriers likely to impact aquatic organisms in the Pacific Southwest region.

Includes 2 states with:

5,704 inventoried dams, including:

  • 773 that have been reconned for social feasibility of removal
  • 369 that have been removed or mitigated, gaining 17,664 miles of reconnected rivers and streams

610,636 or more potential road-related aquatic barriers, including:

  • 17,324 that have been assessed for impacts to aquatic organisms
  • 3,942 that are likely to impact aquatic organisms
  • 345 that have been removed or mitigated, gaining 2,918 miles of reconnected rivers and streams

Progress toward restoring aquatic connectivity:

year removed
show:miles gained|number removed
2024
760 miles
2023
5,818 miles*
2022
80 miles*
2021
371 miles*
2020
161 miles
2010-2019
9,718 miles*
2000-2009
2,797 miles*
before 2000
290 miles
unknown
586 miles*
dams
road-related barriers
* includes 25 dams and / or road-related barriers that could not be correctly located on the aquatic network or were otherwise excluded from the analysis; these contribute toward the count but not the miles gained.
Note: counts above may include both completed as well as active barrier removal or mitigation projects.
Explore how many dams or road-related barriers there are in a state, county, or watershed.
Explore dams and road-related barriers that have been removed or mitigated by state, county, or watershed.
Identify and rank dams or road-related barriers that reconnect the most high-quality aquatic networks.

Statistics by state:

Inventoried damsReconned damsAssessed road-related barriers
California3,92076513,693
Nevada1,78483,631
Total5,70477317,324

1,502 inventoried dams and 587 assessed road-related barriers were not analyzed because they could not be correctly located on the aquatic network or were otherwise excluded from the analysis. You can optionally include these in your download.

Note: These statistics are based on inventoried dams and road-related barriers. Because the inventory is incomplete in many areas, areas with a high number of dams may simply represent areas that have a more complete inventory.

Data Sources
The California Fish Passage Forum and the Pacific States Marine Fisheries Commission have developed and maintain a barrier inventory for the state of California, called the California Fish Passage Assessment Database (PAD). The PAD is an ongoing map-based inventory of known and potential barriers to anadromous fish in California, compiled and maintained through a cooperative interagency agreement. It compiles currently available fish passage information from many different sources, allows past and future barrier assessments to be standardized and stored in one place, and enables the analysis of cumulative effects of passage barriers in the context of overall watershed health. This dataset is the primary dataset used within this tool for the state of California.

You can help!

You can help improve the inventory You can help improve the inventory by sharing data, assisting with field reconnaissance to evaluate the impact of aquatic barriers, or even by reporting issues with the inventory data in this tool.

Contact us to learn more about how you can help improve aquatic connectivity in the Pacific Southwest region.