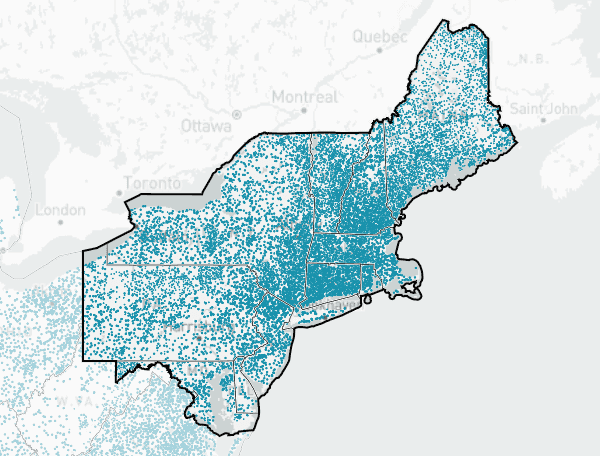
Northeast Region

Includes 11 states and Washington DC with:
29,595 inventoried dams, including:
- 158 that have been reconned for social feasibility of removal
- 1,009 that have been removed or mitigated, gaining 17,160 miles of reconnected rivers and streams
458,178 or more potential road-related aquatic barriers, including:
- 121,578 that have been assessed for impacts to aquatic organisms
- 67,250 that are likely to impact aquatic organisms
- 142 that have been removed or mitigated, gaining 398 miles of reconnected rivers and streams
Progress toward restoring aquatic connectivity:
Statistics by state:
| Inventoried dams | Reconned dams | Assessed road-related barriers | |||
|---|---|---|---|---|---|
| Connecticut | 4,369 | 29 | 5,001 | ||
| Delaware | 132 | 0 | 58 | ||
| District of Columbia | 12 | 1 | 4 | ||
| Maine | 1,057 | 10 | 23,993 | ||
| Maryland | 1,209 | 28 | 3,159 | ||
| Massachusetts | 3,055 | 3 | 7,475 | ||
| New Hampshire | 4,729 | 0 | 20,370 | ||
| New Jersey | 1,952 | 0 | 2,352 | ||
| New York | 7,545 | 60 | 33,132 | ||
| Pennsylvania | 3,812 | 25 | 10,586 | ||
| Rhode Island | 646 | 0 | 598 | ||
| Vermont | 1,077 | 2 | 14,850 | ||
| Total | 29,595 | 158 | 121,578 |
6,324 inventoried dams and 33,225 assessed road-related barriers were not analyzed because they could not be correctly located on the aquatic network or were otherwise excluded from the analysis. You can optionally include these in your download.
Note: These statistics are based on inventoried dams and road-related barriers. Because the inventory is incomplete in many areas, areas with a high number of dams may simply represent areas that have a more complete inventory.
You can help!
You can help improve the inventory You can help improve the inventory by sharing data, assisting with field reconnaissance to evaluate the impact of aquatic barriers, or even by reporting issues with the inventory data in this tool.
Contact us to learn more about how you can help improve aquatic connectivity in the Northeast region.