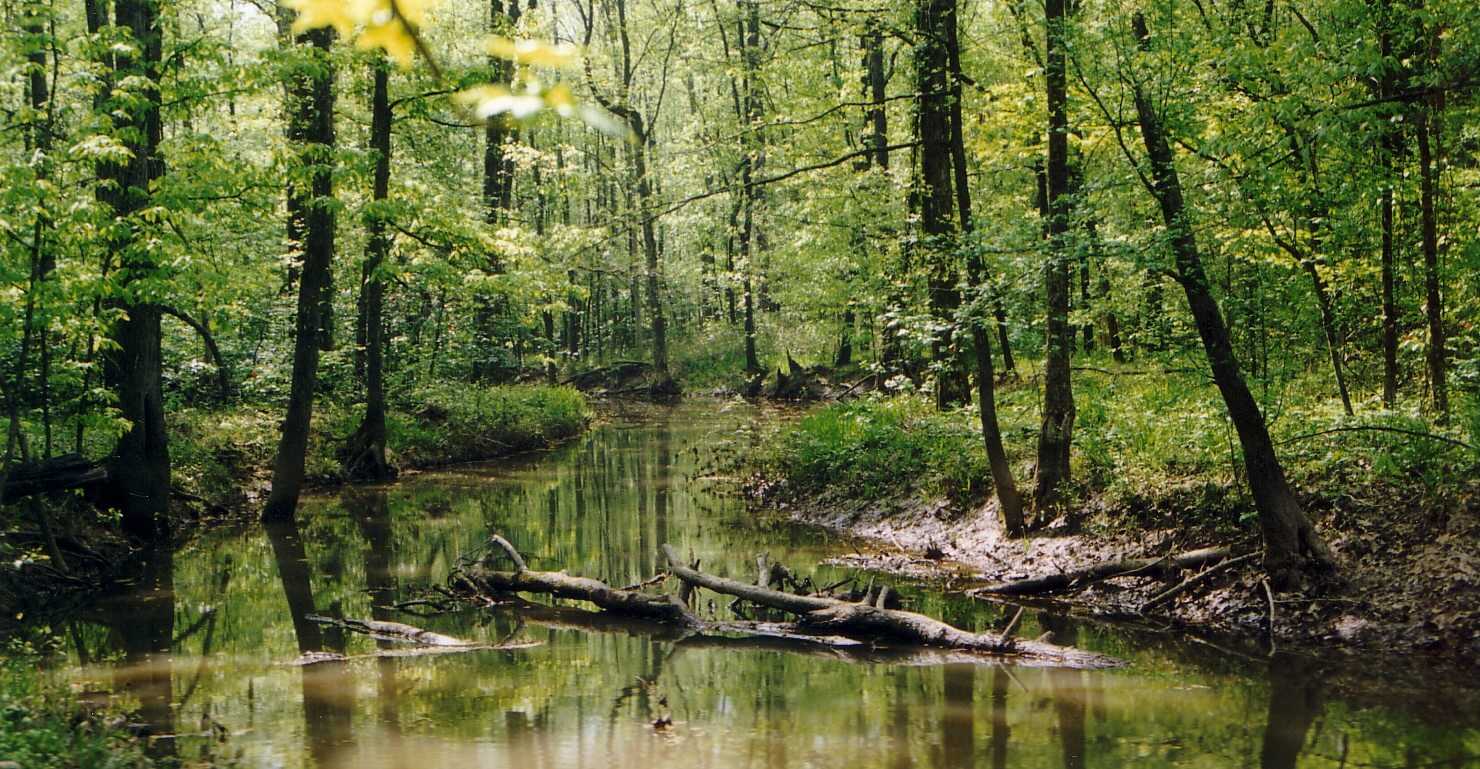
Floodplain natural landcover
Rivers and streams that have a greater amount of natural landcover in their floodplain are more likely to have higher quality aquatic habitat. These areas may have more cool-water refugia for temperature sensitive species due to shading from the overstory, and may have fewer water quality issues. In contrast, rivers that have less natural landcover are more likely to be altered and have impaired water quality.
Low natural landcover
Barriers with less natural landcover are less likely to contribute high quality habitat for aquatic species if removed.
High natural landcover
Barriers with aquatic networks that have more natural landcover are more likely to contribute higher quality habitat if they are removed.
Methods:
- Floodplains are delineated using data derived from FATHOM Inc, which has modeled 30 by 30 meter 100 year floodplain boundaries. For more information visit:
https://iopscience.iop.org/article/10.1088/1748-9326/aaac65/pdf - Natural landcover is derived from the USDA National Landcover Database (NLCD) 2016 30 by 30 meter landcover raster dataset. For more information see: https://www.mrlc.gov/data/nlcd-2016-land-cover-conus.
- Natural landcover is extracted from the overall NLCD dataset and clipped to the floodplain area for analysis.
- The contributing watershed (catchment) of each stream and river reach is extracted from the NHDPlus dataset.
- The total amount of natural landcover within the catchment area as well as the floodplain area of that catchment area are tallied for each functional network.
- Floodplain natural landcover is measured from the overall percent of natural landcover throughout the entire functional network.